Starting with oil: what are we paying for?

I started with a question that seemed straightforward: if disruption around the Gulf persists, could oil producers elsewhere become attractive investments? Canadian and Norwegian companies might continue supplying customers while benefiting from higher prices. Brazil deserves investigation too. But identifying a possible beneficiary leaves another question unanswered: how much of that advantage are we already paying for?
This is the opening instalment of a broader investigation into the major investment sectors. The aim is to examine business fundamentals, the expectations embedded in share prices, and what could undermine them over five to ten years. We also want to test resilience to recession and an AI-led market correction, without assuming either is inevitable.
Our starting scenario is deliberately conditional: disruption persists for another six months, with Brent crude at $150 a barrel during that period. We are not forecasting that price or assuming strategic reserves are about to run out. Emergency stocks can bridge supply losses, but assessing their endurance requires knowing the remaining accessible stocks, the daily shortfall and the scope for alternative supply or reduced demand. The IEA describes reserves as a response to temporary disruption, rather than a permanent supply replacement.
A prolonged shock could squeeze purchasing power and business margins in China and other importing economies, while raising inflation. Recession would become a concern, not an automatic outcome at a particular oil price. Interest-rate decisions would depend on inflation expectations and the severity of the downturn; the IMF stresses that responses will differ across countries. We assume no guaranteed tariff reversal by Trump. Winter conditions would also require a separate assessment of gas supply, storage and weather.
For the first company comparison, we selected Canadian Natural Resources, Suncor, Aker BP and Equinor. Their exposure to production outside the Gulf makes them relevant candidates, but they still face global demand, commodity-price and operational risks. Four energy companies do not constitute a diversified portfolio.
We tested long-run Brent prices of $60, $80 and $100. For the temporary-crisis case, we assumed six months at $150 followed by $80. The additional cash is counted once, discounted back one year. We do not treat the disruption as a permanent improvement in profitability or predict what traders would pay for these shares in six months.
A low P/E during a temporary earnings boom can be misleading, so we focus on cash generation after investment. The valuation uses five annual cash-flow estimates, discounted at 10%, with an additional 10% operating contingency. The business remaining after year five is valued at eight to twelve times that year’s cash flow, also discounted. Those choices are assumptions, not probabilities. Share counts and exchange rates are fixed at the study’s reference inputs; dividends and buybacks are not added again. Financing allowances are included, debt is assumed refinanceable, and debt principal and excess cash are not separately adjusted. Personal taxes and transaction costs are excluded. We use 18 September ECB cross-rates to convert Canadian cash flows into USD and Aker BP’s USD cash flows into NOK.
The company assumptions matter as much as that common formula. For Canadian Natural Resources, we use its published oil-price sensitivity, hold production and costs flat, and deduct C$858 million annually for abandonment. WTI is assumed to remain $5 below Brent, with gas prices unchanged from the company reference case.
For Suncor, we average its three-year cash-flow plan and deduct a C$800 million annual allowance for leases and reclamation. We retain a normal $25 refining-margin benchmark, apply the same Brent–WTI spread, and assume no subsequent growth. Expensive crude does not automatically translate into better refining profits.
For Aker BP, we use published analyst estimates for the 2027–28 project ramp, then hold cash flow flat. We deduct $650 million annually for interest and leases, keep gas-price assumptions unchanged, and apply Norway’s 78% marginal petroleum tax to additional oil receipts. Project completion, spending reductions and tax timing are therefore central to the result.
For Equinor, we interpolate operating cash-flow growth to 2030, then hold it flat. Annual deductions are $12 billion for investment, $2 billion for leases and $800 million for financing. We retain its reference gas prices and exclude the one-off Empire Wind tax credit.
The first results are below. Reference prices are from 18 September 2026; values are per share, in US dollars except Aker BP, which is in Norwegian kroner.
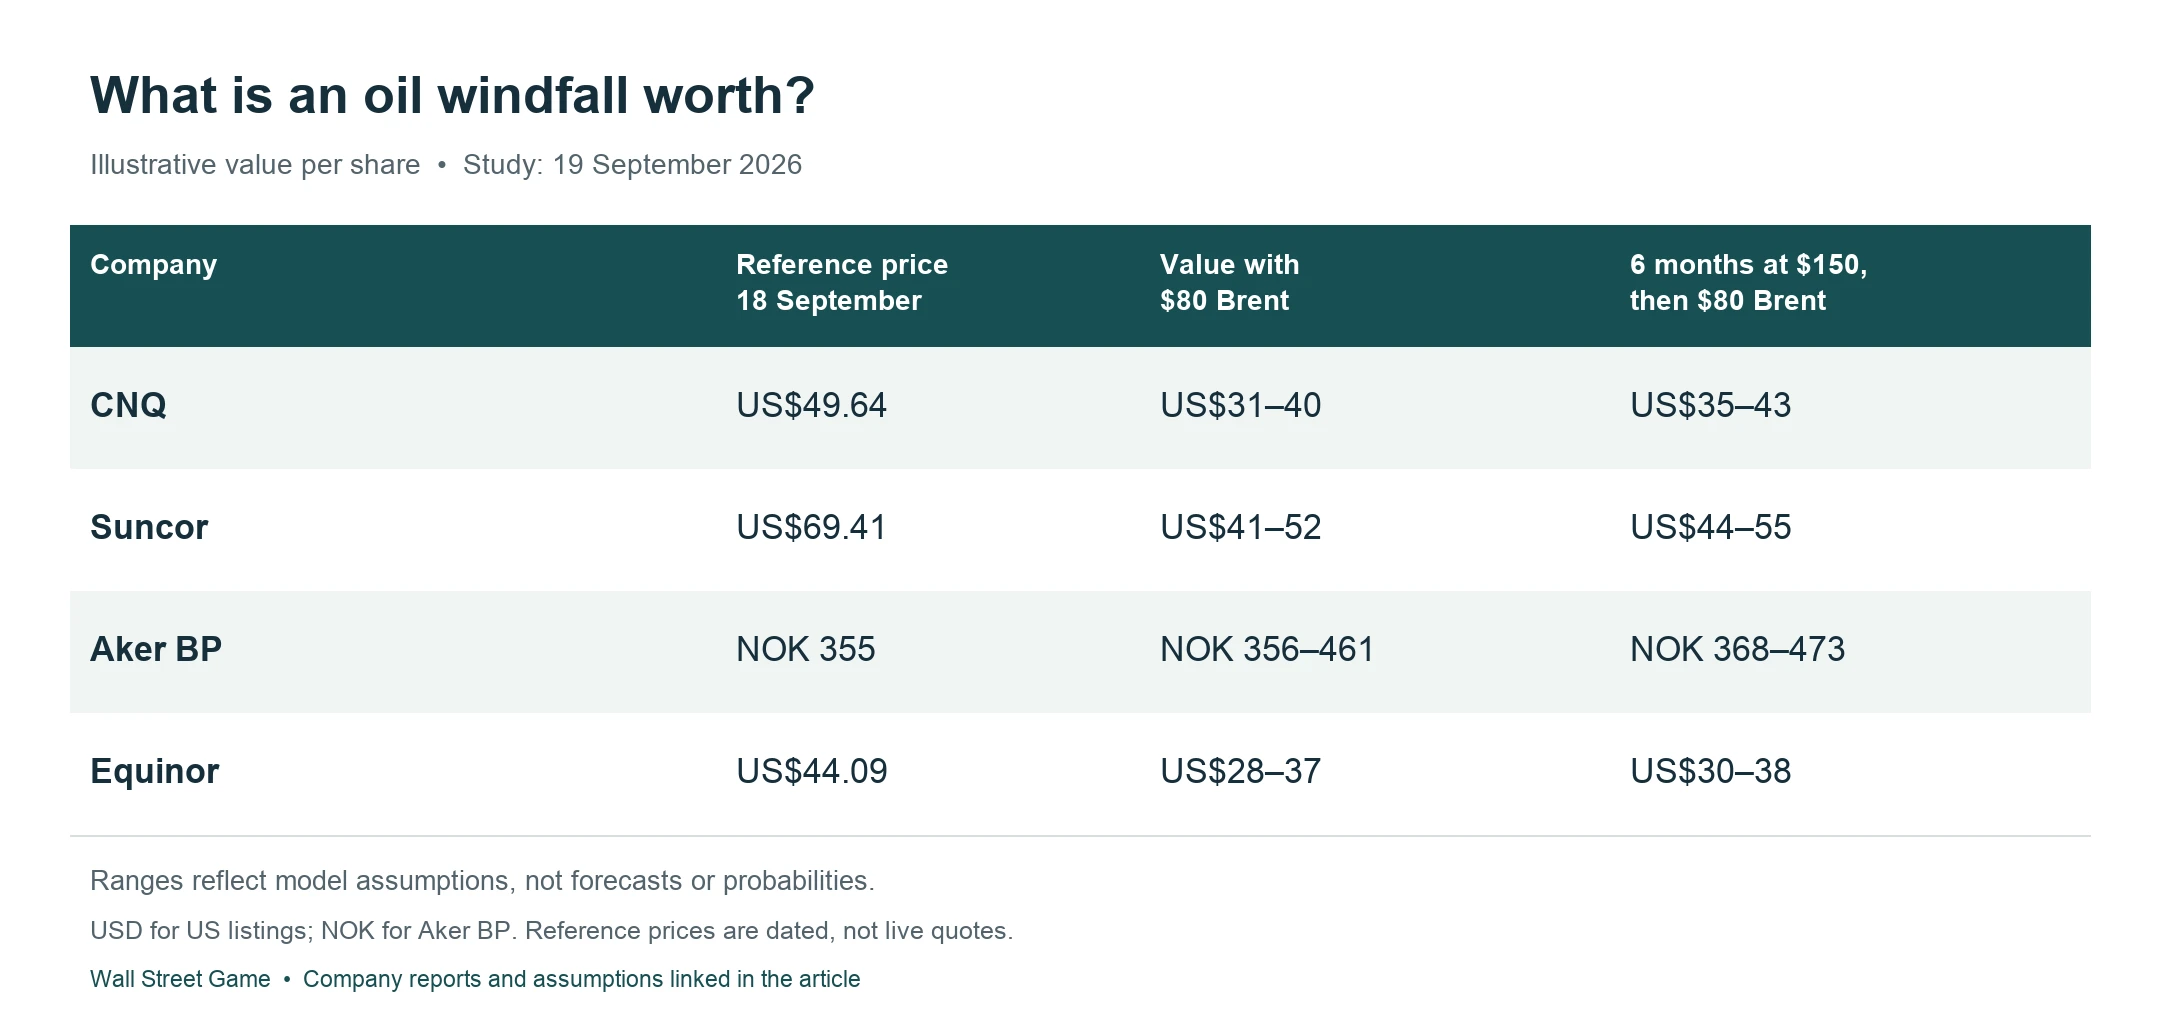
Under these assumptions, three reference prices exceed our moderate-oil valuation ranges. Aker BP looks more interesting, provided its projects deliver. That warrants closer investigation, rather than a confident buy conclusion.
The ranges vary only the final cash-flow multiple. They are neither confidence intervals nor loss limits. Extrapolating oil sensitivities to $150 assumes uninterrupted delivery and unchanged costs; taxes, gas, refining margins, currencies, reserve depletion and replacement investment could change the outcome substantially.
We have added the studies and their assumptions to Wall Street Game’s Research tab, where we can record and revisit the reasoning. Next, we plan to extend the investigation to technology, healthcare, consumer businesses, utilities, industrials, financials and materials. In each sector, we will ask what today’s price requires, what evidence supports those expectations, and what would change our minds.
Originally published on Substack on 19 September 2026.